Spontaneous reporting keeps growing in Italy
Spontaneous reporting data for Italy in 2012 will be shortly published by the AIFA1 portal. Numbers are once again surprising (Figure 1): more than 29,000 reports, with a 35% increase respect to 2011. The increase is higher for drugs (+41%) than for vaccines (+7%). The reporting rate (489 reports for one million inhabitants) has overcome countries with a strong tradition in Pharmacovigilance. For example, in the United Kingdom the yearly published data by MHRA show a quite stable reports-amount in the last 4 years, with a reporting rate of 409/million in 2012.2
The role played by the Pharmacovigilance Regional Centres and the active Pharmacovigilance Projects sponsored by AIFA is essential for the achievement of these results.
Some data must be underlined when considering the regional trend of the last years (Table 1).
The increase in Pharmacovigilance has been registered in every Region. Lombardy and Tuscany have abundantly exceeded 1,000 reports/million, but numbers are higher in every Region – even though a large variability must be acknowledged – and Puglia, Piedmont and Calabria have more than tripled their reporting rate in 2012. The amount of reports has been constantly increasing since 2005. Last year about 9,000 people, mostly health workers, contributed to the reporting system, sending at least one file. The increase in 2012 concerned all professional figures involved in the system, general practitioners included, who had showed a decrease in participation in the last two years. The number of reports from citizens also raised, since they have been involved in the interregional project “Pharmacists and ADR reporting by citizens” (Focus Farmacovigilanza May 2011). The new phase, whose results will be more evident this year, saw the adhesion of six more regions, besides Veneto.
Analysing the origin of the reports we can notice the first effects of the new European rules for Pharmacovigilance.
In 2012 more than half of the reports came from hospital specialists, but for the first time 160 files were sent by anti-poison centres, on the basis of the new definition of adverse reactions, which includes over-dosage, abuse and misuse.
The comment for the situation can only be positive of course, also considering the data relative to the first five months of 2013. In this first part of the year, in fact, reports have increased of 60% respect to the same period in 2012. If confirmed, this trend would take the Italian reporting rate to unimaginable levels only few years ago. It is hard to predict until what point this growth might continue. Clearly the increase will be possible only in the presence of a continue information/education activity by Regional Centres. The number of people sending reports, if compared with the complete numbers, shows how much space is still available for improvements. Hopefully the AIFA, considering the important results that have been achieved, will continue sustaining and coordinating the activities and projects of Regional Centres, and above all their funding.
Amoxicillin, warfarin and acetylsalicylic acid are among the most reported drugs, and this is not a surprise since they have been at the top list for years.
The list includes wide-use drugs like NSAIDs (ketoprofen and ibuprofen), but also drugs with a more specific indications like lenalidomide, oxaliplatin and sorafenib (Table 2). The high amount of reports allows anyway an efficient signals research. The AIFA together with the Pharmacovigilance Regional Centres continues the periodic reports analysis, which allows the publishing of the most relevant signals. Table 3 lists the 2012 signals recently published by the Agency. Besides the analysis of national data, the AIFA and the Regional Centres are deeply involved with the European Agency in the analysis of signals of the Eurpean database Eudravigilance.
In 2012 also the analysis of vaccinations reports has been continued by AIFA and Regional Pharmacovigilance Centres, with experts nominated by Regional Prevention Centres and directed by the National Prevention Centre. The report on vaccinations advers events surveillance for 20113 has been just made available on the AIFA website.
Figure 1 – Number of spontaneous reports in Italy from 2001 to 2012
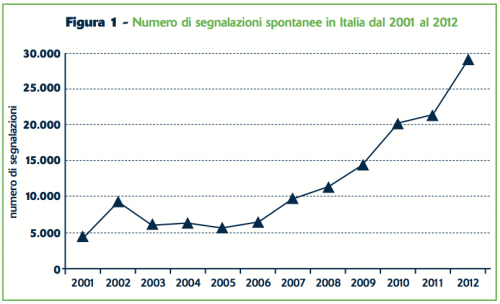
Table 1 – Reporting rate (amount of reports for one million inhabitants) of Italian Regions from 2009 to 2012, listed by ranking
Region | Reporting rate | Ranking | ||||||
| 2009 | 2010 | 2011 | 2012 | 2009 | 2010 | 2011 | 2012 |
Tuscany | 457.6 | 510.4 | 852.0 | 1,213.5 | 2 | 3 | 2 | 1 |
Lombardy | 575.8 | 866.7 | 945.0 | 1,199.7 | 1 | 1 | 1 | 2 |
Piedmont | 124.4 | 143.8 | 157.9 | 482.6 | 14 | 16 | 13 | 3 |
Emilia-Romagna | 277.5 | 295.6 | 281.3 | 457.0 | 6 | 6 | 5 | 4 |
Autonomous Province of Trento | 291.4 | 262.8 | 266.7 | 328.7 | 5 | 8 | 7 | 5 |
Puglia | 83.0 | 68.9 | 90.9 | 325.2 | 18 | 20 | 19 | 6 |
Basilicata | 332.8 | 335.0 | 392.7 | 321.8 | 4 | 4 | 3 | 7 |
Campania | 111.4 | 164.2 | 261.1 | 319.0 | 16 | 13 | 9 | 8 |
Friuli- Venezia Giulia | 264.2 | 324.4 | 161.7 | 298.9 | 9 | 5 | 12 | 9 |
Veneto | 265.9 | 546.8 | 263.7 | 290.3 | 8 | 2 | 8 | 10 |
Marche | 219.2 | 176.4 | 200.5 | 258.9 | 10 | 10 | 10 | 11 |
Abruzzo | 107.5 | 167.7 | 122.5 | 248.1 | 17 | 12 | 17 | 12 |
Calabria | 43.3 | 49.7 | 71.5 | 236.0 | 21 | 21 | 21 | 13 |
Autonomous Province of Bolzano | 266.4 | 173.2 | 186.1 | 226.7 | 7 | 11 | 11 | 14 |
Valle d’Aosta | 187.5 | 93.8 | 78.7 | 173.2 | 11 | 18 | 20 | 15 |
Lazio | 75.0 | 153.6 | 276.5 | 167.3 | 20 | 15 | 6 | 16 |
Sicily | 126.1 | 159.4 | 138.6 | 159.4 | 13 | 14 | 15 | 17 |
Umbria | 117.6 | 98.2 | 140.4 | 146.1 | 15 | 17 | 14 | 18 |
Liguria | 187.5 | 225.1 | 134.7 | 129.5 | 11 | 9 | 16 | 19 |
Sardinia | 81.9 | 71.0 | 104.4 | 120.3 | 19 | 19 | 18 | 20 |
Molise | 387.5 | 268.8 | 361.0 | 79.9 | 3 | 7 | 4 | 21 |
Table 2 – List of most reported drugs in 2012
| N. reports | Severe adverse reactions (%) |
Amoxicillin/ clavulanic acid | 1,361 | 21.00 |
Warfarin | 1,347 | 36.00 |
Acetylsalicylic acid | 936 | 43.00 |
Lenalidomide | 590 | 23.00 |
Oxaliplatin | 577 | 30.00 |
Ketoprofen | 560 | 31.00 |
Amoxicillin | 514 | 18.00 |
Sorafenib | 460 | 15.00 |
Levofloxacin | 457 | 35.00 |
Ibuprofen | 383 | 27.00 |
Cetuximab | 370 | 21.00 |
Bevacizumab | 367 | 31.00 |
Ceftriaxone | 365 | 42.00 |
Acetaminophen | 351 | 29.00 |
Clopidogrel | 306 | 34.00 |
Table 3 – The 8 signals of 2012
Signal | Tipology | Semester 2012 |
Benzodiazepines and rhabdomyolysis | new | 1st |
Incretin and pancreatitis | class | 1st |
Pioglitazone and bladder carcinoma | class | 1st |
Proton pump inhibitors and impotence | class | 1st |
Cortisone and hiccups | new | 1st |
Erlotinib and hand-foot syndrome | new | 1st |
Natalizumab and thrombocytopenia | new | 1st |
Rupatadine and heart frequency and rhythm disturbances | new | 2nd |